
In This Article
On December 11, 2001, the People’s Republic of China officially became the 143rd member of the World Trade Organization (WTO), concluding fifteen years of arduous bilateral and multilateral negotiations. Spearheaded domestically by Premier Zhu Rongji, WTO accession locked in sweeping unilateral tariff reductions that brought China’s simple average statutory import tariff down from 43.2 percent in 1992 to 15.3 percent upon entry in 2001, and to 9.8 percent by 2010. Coupled with China’s duty-free “processing trade” (jiagong maoyi) customs regime and the 2005 abolition of global textile quotas under the Multi-Fibre Arrangement, WTO membership propelled China from 3.9 percent of global merchandise exports in 2000 to the world’s largest exporter by 2009 and over 14 percent of global goods exports by 2020. Yet the very scale of that manufacturing surge—and Beijing’s state-backed push into advanced technologies—triggered a historic policy reversal in Washington, culminating in the 2018–2025 Section 301 tariff war that dismantled the post-2001 bilateral tariff peace and reshaped global supply chains. [1]
Zhu Rongji’s Tariff Reform and the December 2001 WTO Protocol
Throughout the 1980s and early 1990s, China maintained one of the most heavily protected import regimes in the developing world. When Beijing first applied in July 1986 to resume its contracting-party status under the General Agreement on Tariffs and Trade (GATT), Chinese foreign trade was still monopolized by a handful of state Foreign Trade Corporations (FTCs), buffered by high statutory duties, complex import licensing, quotas, and multiple exchange rates. Even in 1992, China’s simple average statutory import tariff stood at an daunting 43.2 percent. [2]
During the 1990s, reformist leaders led by Vice Premier and later Premier Zhu Rongji used the external leverage of GATT/WTO negotiations to overcome domestic ministerial resistance and force state-owned enterprises (SOEs) into market competition. Beginning with unification of the dual exchange rate in January 1994, Beijing executed a sequence of unilateral tariff reductions that cut the average statutory tariff to 35.9 percent in 1995, 23.0 percent in 1996, and 15.3 percent on the eve of WTO entry in 2001. In November 1999, US Trade Representative Charlene Barshefsky and Chinese Trade Minister Shi Guangsheng signed the landmark US–China bilateral WTO agreement in Beijing, paving the way for the US Congress to grant China Permanent Normal Trade Relations (PNTR) in October 2000—eliminating the annual threat of losing Most-Favored-Nation (MFN) tariff status in the American market. [3]
Under its December 11, 2001 Accession Protocol, China bound 100 percent of its tariff lines in the WTO schedule and committed to lower its overall simple average tariff from 15.3 percent to 9.8 percent by 2010, with average industrial tariffs falling from 14.7 percent to 8.9 percent and agricultural tariffs dropping from 23.2 percent to 15.2 percent. Under the Information Technology Agreement (ITA), China eliminated tariffs entirely on computers, semiconductors, and telecommunications equipment. Equally transformative, Beijing abolished over 400 categories of import quotas and licenses by 2005 and granted automatic foreign-trade rights (waimao jingyingquan) to all domestic private and foreign-invested enterprises, breaking the state monopoly over cross-border commerce. [4]
| Documented Figure / Metric | Historical Significance & Archival Context |
|---|---|
| 50 percent | Between 1995 and 2007, processing trade consistently generated between 50 percent and 57 percent of China's total merchandise exports, and an even higher share—exceeding 80 percent—of China's high-technology and electronics exports, such as laptop computers, mobile phones, and digital cameras. |
| 55 percent | Consequently, the share of customs-bonded processing trade fell from 55 percent of Chinese exports in 2004 to roughly 35 percent by 2015 and below 25 percent by 2023, while domestic value added per dollar of Chinese exports rose substantially. |
| $370 billion | In less than twenty months, the trade-weighted average US tariff on Chinese imports jumped more than sixfold, from 3.1 percent in January 2018 to 19.3 percent in early 2020, covering roughly $370 billion of bilateral trade. |
The Engine of Factory Asia: Processing Trade (Jiagong Maoyi)
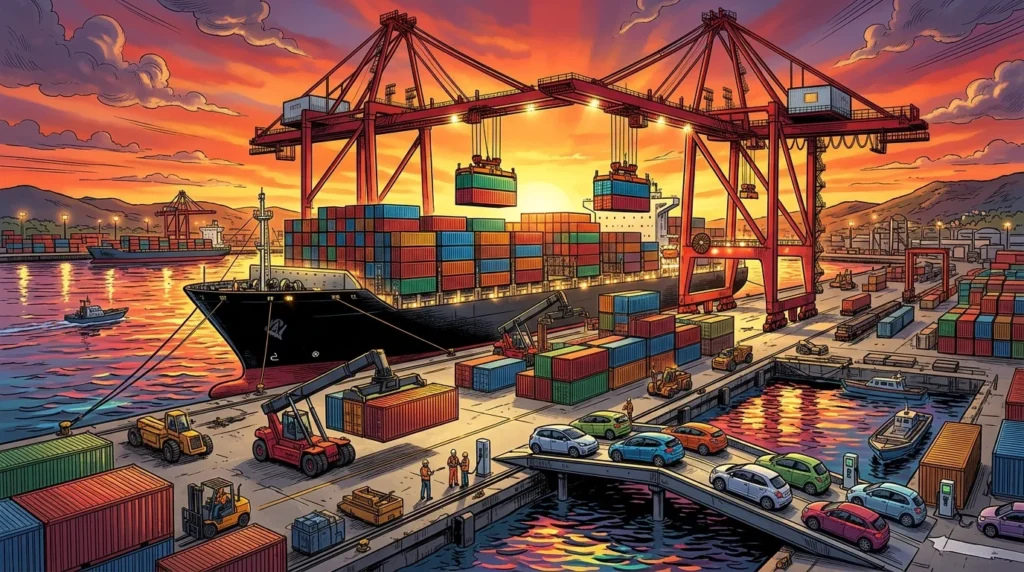
Even before statutory tariffs fell below 10 percent, China had engineered a powerful institutional bypass that allowed coastal export factories to operate in a virtually free-trade environment: processing trade (jiagong maoyi). Codified by the General Administration of Customs in the late 1980s and expanded across Special Economic Zones and coastal industrial parks, the processing-trade regime exempted enterprises from paying import tariffs and value-added taxes (VAT) on raw materials, parts, and intermediate components—provided those imported inputs were processed or assembled inside China and re-exported as finished products within a stipulated period under customs bond. [5]
Chinese customs law divided processing trade into two contractual forms: “processing with supplied materials” (lailiao jiagong), in which a foreign buyer retained title to the imported components and paid the Chinese factory a processing fee, and “processing with imported materials” (jinliao jiagong), in which a factory in China—most often a foreign-invested enterprise (FIE) owned by Taiwanese, Hong Kong, Japanese, South Korean, American, or European multinationals—purchased imported inputs under bond, assembled the final product, and sold it abroad. By insulating export assembly from domestic tariff barriers and customs bottlenecks, processing trade turned the Pearl River Delta and Yangtze River Delta into the final assembly hub of “Factory Asia.”
The numbers illustrate the centrality of this mechanism. Between 1995 and 2007, processing trade consistently generated between 50 percent and 57 percent of China’s total merchandise exports, and an even higher share—exceeding 80 percent—of China’s high-technology and electronics exports, such as laptop computers, mobile phones, and digital cameras. When the global quota system governing textiles and apparel under the Multi-Fibre Arrangement (MFA) and WTO Agreement on Textiles and Clothing (ATC) expired on January 1, 2005, China’s ordinary trade surged alongside processing trade. China’s total merchandise exports exploded nearly sixfold in a single decade, rising from $249.2 billion in 2000 (3.9 percent of world exports) to $1.20 trillion in 2009 (9.6 percent of world exports, overtaking Germany as the world’s No. 1 merchandise exporter) and reaching $1.58 trillion by 2010. [6]
Climbing the Value Chain and the “China Shock” Debate
Over the decade following the 2008–2009 global financial crisis, the internal composition of Chinese exports underwent a profound structural shift. As lower-Auto and component tariffs reduced input costs for non-bonded domestic firms and Chinese industrial clusters developed deep local networks of machinery, chemical, metal, and electronics suppliers, Chinese manufacturers progressively substituted domestically produced intermediate components for imported foreign parts. Consequently, the share of customs-bonded processing trade fell from 55 percent of Chinese exports in 2004 to roughly 35 percent by 2015 and below 25 percent by 2023, while domestic value added per dollar of Chinese exports rose substantially. [7]
In the United States and Europe, China’s rapid industrial ascent and persistent bilateral trade surpluses sparked intense economic and political backlash. While research by Federal Reserve Bank of New York economists Mary Amiti, Mi Dai, Robert Feenstra, and John Romalis demonstrated that China’s WTO entry significantly lowered US consumer manufacturing prices—primarily by reducing Chinese input tariffs and expanding product variety—other influential studies by David Autor, David Dorn, and Gordon Hanson documented concentrated job losses in import-competing US manufacturing regions. At the same time, Western governments and business associations increasingly protested China’s state-capitalist industrial subsidies, joint-venture technology-transfer requirements, and the May 2015 launch of the “Made in China 2025” strategic plan aimed at achieving domestic self-sufficiency in ten high-technology industries. [8]
2018–2025: The US–China Section 301 Tariff War and Supply-Chain Rerouting
In August 2017, the Trump administration bypassed the WTO’s multilateral dispute settlement system and directed US Trade Representative Robert Lighthizer to open an investigation into China’s technology transfer, intellectual property, and innovation policies under Section 301 of the US Trade Act of 1974. Following the USTR’s March 2018 affirmative report, the United States unleashed four escalating waves of punitive tariffs across 2018 and 2019: List 1 ($34 billion at 25 percent in July 2018), List 2 ($16 billion at 25 percent in August 2018), List 3 ($200 billion at 10 percent in September 2018, raised to 25 percent in May 2019), and List 4A (roughly $120 billion at 15 percent in September 2019, halved to 7.5 percent under the January 15, 2020 Phase One Economic and Trade Agreement). In less than twenty months, the trade-weighted average US tariff on Chinese imports jumped more than sixfold, from 3.1 percent in January 2018 to 19.3 percent in early 2020, covering roughly $370 billion of bilateral trade.
Beijing immediately retaliated with counter-tariffs on over $110 billion of American agricultural, energy, and automotive exports—raising average Chinese tariffs on US goods from 8.0 percent to over 20 percent while cutting selective Most-Favored-Nation tariffs for non-US trading partners—and filed a formal challenge at the WTO (**Dispute DS543**). Although a WTO dispute panel ruled in September 2020 that the unilateral US Section 301 tariffs violated GATT Articles I and II because they applied solely to China and exceeded bound WTO rates, the United States appealed the ruling into the defunct WTO Appellate Body and kept the tariffs intact. In May 2024, the Biden administration retained the existing Section 301 duties and imposed steep new tariff hikes on $18 billion of strategic Chinese clean-tech and hardware categories—including a 100 percent tariff on Chinese electric vehicles (EVs), 50 percent on solar cells and semiconductors, and 25 percent on lithium-ion batteries, steel, aluminum, and critical minerals—before fresh tariff escalations in 2025 pushed effective bilateral rates higher still.
Rather than halting Chinese manufacturing, the 2018–2025 Section 301 tariff wall triggered a massive geographic reorganization of global value chains. Multinational electronics, apparel, and furniture producers adopted “China Plus One” strategies, shifting final assembly of US-bound goods to **Vietnam, Mexico, Malaysia, Thailand, and India**, even as those assembly hubs increased their imports of Chinese fabrics, battery cells, printed circuit boards, and industrial machinery. Meanwhile, Chinese exporters pivoted aggressively toward ASEAN, Latin America, the Middle East, and Europe, led by the “New Three” (xin san yang) capital-intensive export pillars—electric vehicles, lithium-ion batteries, and photovoltaic solar modules—keeping China’s share of world merchandise exports above 14 percent a quarter-century after its historic entry into the WTO.
Theoretical & Balance-Sheet Transmission Mechanism
In the Kindleberger–Minsky taxonomy of financial instability (Kindleberger, 1978; Minsky, 1986) and Irving Fisher’s (1933) debt-deflation framework, speculative asset booms become systemic crises when credit expansion shifts balance sheets from hedge finance (cash flows covering principal and interest) to speculative and Ponzi finance (relying on rising asset prices and short-term margin roll-overs).
Once monetary tightening or an exogenous shock halts price appreciation, forced margin liquidations trigger Fisherian debt-deflation: fire-sale asset discounts erode bank collateral values, contracting credit supply across the real economy.
Sources and Further Reading
- Office of the United States Trade Representative (USTR), “ Background Information on China’s Accession to the World Trade Organization,” USTR Archive Fact Sheet, 2001. Official / State Archive
- Lee Branstetter and Nicholas Lardy, “ China’s Embrace of Globalization,” National Bureau of Economic Research (NBER) Working Paper No. 12373, 2006. Peer-Reviewed / Academic Research
- Mary Amiti, Mi Dai, Robert C. Feenstra, and John Romalis, “ How Did China’s WTO Entry Affect U.S. Prices?,” Federal Reserve Bank of New York Staff Reports No. 817, 2017. Central Bank / Monetary Authority
- Joshua P. Meltzer and Neena Shenai, “ The US-China Economic Relationship: A Comprehensive Approach,” Brookings Institution and American Enterprise Institute, 2019. Peer-Reviewed / Academic Research
- World Trade Organization (WTO), “ DS543: United States — Tariff Measures on Certain Goods from China,” WTO Dispute Settlement, 2020. International Financial Institution
- Peterson Institute for International Economics (PIIE), “ PIIE Briefing 26-2: US-China Trade, Tariffs, and Global Supply Chains,” Peterson Institute for International Economics, 2026. Historical & Financial Reference
- Irving Fisher — "The Debt-Deflation Theory of Great Depressions," Econometrica 1, no. 4 (FRASER Federal Reserve Archive, 1933): 337–357 Central Bank / Monetary Authority
- Charles P. Kindleberger & Robert Z. Aliber — Manias, Panics, and Crashes: A History of Financial Crises (Palgrave Macmillan) Peer-Reviewed / Academic Research
Cite This Historical Dossier (APA / Chicago)
APA (7th ed.): Ç., S. (Ed.). (2026). China’s WTO Boom and the Return of America’s Tariff War. In Forgotten Fortunes Historical Monograph Series (Forgotten Fortunes Editorial Desk). https://forgottenfortunes.net/china-wto-accession-us-tariffs/
MLA (9th ed.): Ç., Soner, ed. "China’s WTO Boom and the Return of America’s Tariff War." Forgotten Fortunes: Financial & Monetary History Archive, 2026, https://forgottenfortunes.net/china-wto-accession-us-tariffs/.
Chicago (17th ed.): Ç., Soner, ed. "China’s WTO Boom and the Return of America’s Tariff War." Forgotten Fortunes Historical Monograph Series (Forgotten Fortunes Editorial Desk), September 18, 2026. https://forgottenfortunes.net/china-wto-accession-us-tariffs/.
Have an idea for another financial history documentary or article? Request a story →