
In This Article
Between 1989 and 2011, Australia executed one of the most consequential macroeconomic transformations in modern central banking history. Entering the late 1980s with entrenched inflation expectations inherited from the 1970s commodity and wage shocks, the Reserve Bank of Australia (RBA) and Federal Treasurer Paul Keating pushed overnight cash rates to an extraordinary peak of 18 percent in late 1989. The resulting contraction of 1990–1991—famously characterized by Keating in November 1990 as “the recession that Australia had to have”—snapped the country’s inflationary psychology at the cost of double-digit unemployment. Out of that crisis, RBA Governor Bernie Fraser introduced a flexible medium-term inflation target of 2 to 3 percent in March 1993, a regime formally codified in August 1996 by incoming Governor Ian Macfarlane and Treasurer Peter Costello. Anchored by this framework and a freely floating exchange rate, Australia subsequently weathered the 1997 Asian Financial Crisis and absorbed a century-high terms-of-trade surge during the 2001–2011 China mining boom, which propelled the Australian dollar from an all-time low of US$0.4775 in April 2001 to a post-float peak of US$1.1080 in July 2011. [1]

The 1980s Credit Boom and the 18% Cash Rate Tightening
The roots of Australia’s monetary regime shift lay in the interaction between financial deregulation and persistent inflation during the 1980s. Following the float of the Australian dollar in December 1983 and the removal of interest rate controls and lending directives on commercial banks, domestic credit expanded at rates exceeding 20 percent per year. Although the Prices and Incomes Accord between the Hawke–Keating Labor government and the Australian Council of Trade Unions moderated real unit labor costs after 1983, Consumer Price Index (CPI) inflation in Australia averaged roughly 8 percent per annum through the 1980s—nearly double the average of major OECD economies. [2]
After the October 1987 global stock market crash, the RBA eased monetary policy slightly, fearing an international downturn. Instead, a surge in Australian export commodity prices and an aggressive corporate borrowing binge fueled a domestic commercial property and asset boom in 1988. With domestic demand outstripping productive capacity, the current account deficit widened toward 6 percent of gross domestic product (GDP) and annual inflation remained stubbornly above 7 percent. Beginning in April 1988, the RBA embarked on an eighteen-month tightening cycle. Operating through its daily market operations before the era of formal public rate announcements, the central bank ratcheted the overnight cash rate upward from roughly 11 percent in early 1988 to a peak of 18 percent by November 1989. Standard variable home-mortgage interest rates for Australian households climbed to 17 percent, while commercial borrowers and highly leveraged property developers faced effective borrowing rates exceeding 20 percent. [3]
| Documented Figure / Metric | Historical Significance & Archival Context |
|---|---|
| 1.7 percent | Real GDP contracted by roughly 1.7 percent from peak to trough between mid-1990 and mid-1991, while the national unemployment rate rose from just under 6 percent in late 1989 to a post-war high of 11.2 percent in December 1992. |
| US$0.477 | In April 2001, the Australian dollar touched an all-time post-float low of US$0.4775, cushioning domestic exporters and enabling Australia to grow right through both the 1997–1998 Asian crisis and the 2001 U.S. recession. |
| 85 percent | Contract prices for iron ore and coking coal multiplied severalfold, lifting Australia's terms of trade (the ratio of export prices to import prices) by roughly 85 percent between 2001 and their peak in the third quarter of 2011—the highest level recorded since the nineteenth-century wool and gold booms. |
| 3 percent | During the 2001–2011 mining boom, the combination of a floating exchange rate and the 2–3 percent inflation target absorbed the shock. |
Paul Keating’s “Recession We Had to Have” (1990–1991)
The punitive 18 percent cash rate interacted violently with overloaded corporate balance sheets across Australia. Throughout 1990 and 1991, commercial property valuations in Melbourne and Sydney collapsed by more than 40 percent, triggering the failure of major entrepreneurial conglomerates, non-bank financial institutions such as the Pyramid Building Society in Victoria, and the State Bank of Victoria and State Bank of South Australia. Even Australia’s largest private commercial lender, Westpac Banking Corporation, suffered heavy loan write-downs that forced emergency capital restructurings. [4]
On November 29, 1990, after September-quarter national accounts confirmed that real GDP had contracted for two consecutive quarters, Treasurer Paul Keating addressed a Canberra press conference and declared bluntly that the downturn was “a recession that Australia had to have.” Keating argued that without a decisive break in excessive domestic spending and speculative debt, Australia risked a permanent current account crisis and Latin American-style currency devaluations. Real GDP contracted by roughly 1.7 percent from peak to trough between mid-1990 and mid-1991, while the national unemployment rate rose from just under 6 percent in late 1989 to a post-war high of 11.2 percent in December 1992. [5]
Yet the macroeconomic consequence that endured was what economist Ross Garnaut and central bankers later termed “snapping the stick of inflation.” Headline CPI inflation fell from 8.7 percent in early 1990 to below 2 percent by 1992, while household and business inflation expectations dropped permanently from the 8–10 percent range into the low single digits. Recognising the depth of the contraction, the RBA cut the official cash rate fifteen times between January 1990 and July 1993, bringing it down from 18 percent to 4.75 percent. [6]
Bernie Fraser’s 1993 Flexible Inflation Target and the 1996 Accord
Having paid a heavy social and economic price to achieve low inflation, RBA officials sought a new nominal anchor to prevent price pressures from reigniting as the recovery gained traction. Earlier experiments with monetary-aggregate targeting (the M3 “conditional projections” used between 1976 and January 1985) had been abandoned because financial deregulation rendered money demand unstable, and the late-1980s “checklist” approach had lacked transparency and discipline. At the same time, Governor Bernie Fraser (who led the RBA from September 1989 to September 1996) was skeptical of the rigid, narrow 0–2 percent point-in-time target adopted by the Reserve Bank of New Zealand in 1990, warning that strict short-horizon bands could force a central bank in a commodity-exporting economy to engineer unnecessary output contractions. [7]
In a landmark speech in March 1993, and in subsequent addresses through 1994, Fraser articulated Australia’s distinctive monetary formula: holding underlying consumer price inflation to an average of “around 2 to 3 per cent over a period of years”—soon refined to “between 2 and 3 per cent, on average, over the cycle.” Rather than treating 3 percent as a hard ceiling that required immediate recessionary tightening whenever breached by a temporary supply shock or exchange-rate move, the phrasing “on average, over the cycle” gave the RBA Board room to look through short-term volatility and factor employment and output stability into its deliberations. [8]
When the Coalition government under Prime Minister John Howard and Treasurer Peter Costello took office in March 1996 and appointed Deputy Governor Ian Macfarlane to succeed Fraser, the two institutions moved to place the framework beyond partisan dispute. On August 14, 1996, Costello and Macfarlane signed the inaugural Statement on the Conduct of Monetary Policy. In that document, the Australian government formally recognized the operational independence of the RBA to set interest rates without political veto and endorsed the flexible 2 to 3 percent medium-term inflation target as the operational fulfillment of the RBA’s statutory charter under the Reserve Bank Act 1959—which mandates stability of the currency, maintenance of full employment, and the economic prosperity and welfare of the Australian people.
The 2001–2011 China Mining Boom and the US$1.1080 Aussie Dollar
The resilience of Australia’s flexible inflation target and floating currency was soon tested by two opposite extremes of the global economy. Between 1998 and early 2001, during the Asian Financial Crisis and the global technology boom, investors rotated heavily out of commodity-linked economies—dubbed “old economy” exporters—into United States technology equities. Rather than raising interest rates to defend the currency as it had in the mid-1980s, the RBA allowed the Australian dollar to depreciate smoothly as a shock absorber. In April 2001, the Australian dollar touched an all-time post-float low of US$0.4775, cushioning domestic exporters and enabling Australia to grow right through both the 1997–1998 Asian crisis and the 2001 U.S. recession.
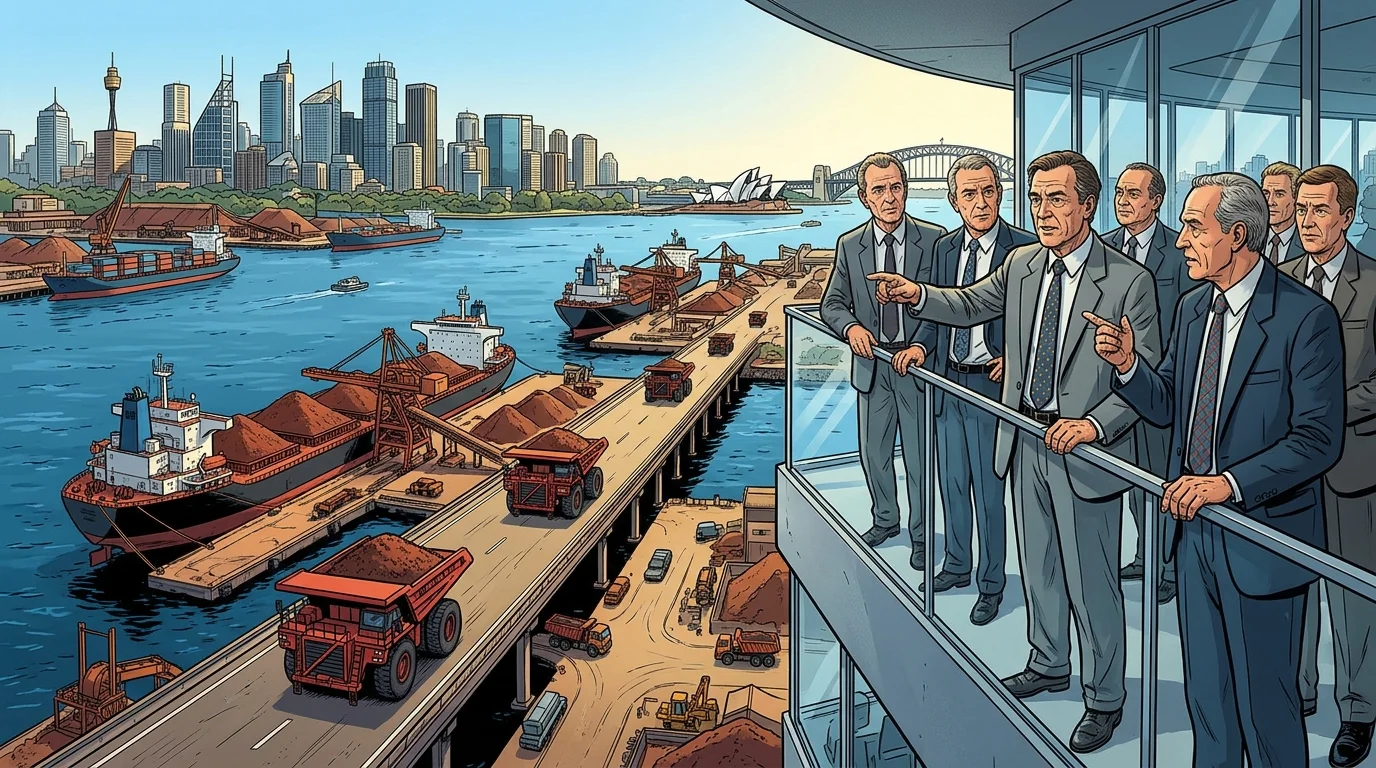
From 2003 onward, the macroeconomic challenge inverted completely. Rapid industrialization, urban construction, and steel production in China triggered an extraordinary global surge in demand for Australian iron ore from the Pilbara region of Western Australia and metallurgical and thermal coal from Queensland and New South Wales. Contract prices for iron ore and coking coal multiplied severalfold, lifting Australia’s terms of trade (the ratio of export prices to import prices) by roughly 85 percent between 2001 and their peak in the third quarter of 2011—the highest level recorded since the nineteenth-century wool and gold booms. Mining investment rose from its historical norm of 2 percent of GDP to nearly 9 percent of GDP.
In earlier Australian commodity booms—such as the 1850s gold rush, the 1950–1951 Korean War wool boom, and the 1970s mineral boom—fixed or managed exchange rates had forced export windfalls directly into the domestic money supply, sparking double-digit inflation followed by painful busts. During the 2001–2011 mining boom, the combination of a floating exchange rate and the 2–3 percent inflation target absorbed the shock. The Australian dollar appreciated by more than 130 percent from its April 2001 trough, reaching parity (US$1.00) in October 2010 and climbing to a post-float peak of US$1.1080 on July 27, 2011. This currency appreciation redirected demand toward imports, cooled tradables inflation, and spared the RBA from having to raise the cash rate above 7.25 percent (reached in March 2008). As a result, Australia completed nearly three decades of uninterrupted annual economic growth between 1991 and 2020 while keeping headline CPI inflation anchored at an average of 2.5 percent.
Theoretical & Balance-Sheet Transmission Mechanism
In the Kindleberger–Minsky taxonomy of financial instability (Kindleberger, 1978; Minsky, 1986) and Irving Fisher’s (1933) debt-deflation framework, speculative asset booms become systemic crises when credit expansion shifts balance sheets from hedge finance (cash flows covering principal and interest) to speculative and Ponzi finance (relying on rising asset prices and short-term margin roll-overs).
Once monetary tightening or an exogenous shock halts price appreciation, forced margin liquidations trigger Fisherian debt-deflation: fire-sale asset discounts erode bank collateral values, contracting credit supply across the real economy.
Sources and Further Reading
- Philip Lowe, “ Twenty-Five Years of Inflation Targeting in Australia,” Bank for International Settlements / Reserve Bank of Australia, 2018. Central Bank / Monetary Authority
- Ken Henry, “ Revisiting the Policy Requirements of the Terms of Trade Boom,” Australian Treasury, 2006. Official / State Archive
- Selwyn Cornish, “ The Adoption of Inflation Targeting in Australia,” Centre for Economic History, Australian National University, 2018. Peer-Reviewed / Academic Research
- Stephen Bell, “ Summoning the Nerve: The Reserve Bank of Australia and the 1989–90 Tightening Episode,” University of Auckland Working Papers in Economics, 1999. Historical & Financial Reference
- David Gruen and Tro Kortian, “ Why Does the Australian Dollar Move so Closely with the Terms of Trade?,” Reserve Bank of Australia Research Discussion Paper 9601, 1996. Historical & Financial Reference
- Reserve Bank of Australia, “ Structural Change in the Australian Economy and the Mining Boom,” RBA Bulletin, 2014. Historical & Financial Reference
- Irving Fisher — "The Debt-Deflation Theory of Great Depressions," Econometrica 1, no. 4 (FRASER Federal Reserve Archive, 1933): 337–357 Central Bank / Monetary Authority
- Charles P. Kindleberger & Robert Z. Aliber — Manias, Panics, and Crashes: A History of Financial Crises (Palgrave Macmillan) Peer-Reviewed / Academic Research
Cite This Historical Dossier (APA / Chicago)
APA (7th ed.): Ç., S. (Ed.). (2026). Australia's 18% Rate Shock, the 2%–3% Inflation Target, and the Mining Boom. In Forgotten Fortunes Historical Monograph Series (Forgotten Fortunes Editorial Desk). https://forgottenfortunes.net/rba-inflation-target-australia/
MLA (9th ed.): Ç., Soner, ed. "Australia's 18% Rate Shock, the 2%–3% Inflation Target, and the Mining Boom." Forgotten Fortunes: Financial & Monetary History Archive, 2026, https://forgottenfortunes.net/rba-inflation-target-australia/.
Chicago (17th ed.): Ç., Soner, ed. "Australia's 18% Rate Shock, the 2%–3% Inflation Target, and the Mining Boom." Forgotten Fortunes Historical Monograph Series (Forgotten Fortunes Editorial Desk), September 15, 2026. https://forgottenfortunes.net/rba-inflation-target-australia/.
Have an idea for another financial history documentary or article? Request a story →